Prices will vary on size and complexity. Turn around is 24 hours.
Why you need to have Floor Plans
New – Floorplan Photo Tours
Our Current Pricing – Contact Us
New – Floorplan Reports, incuded free.
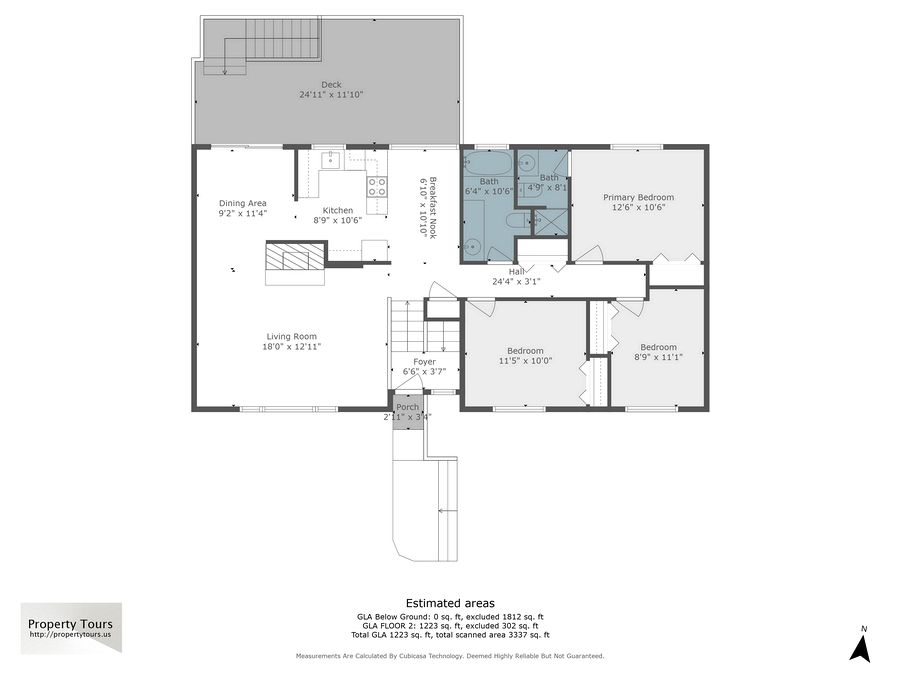
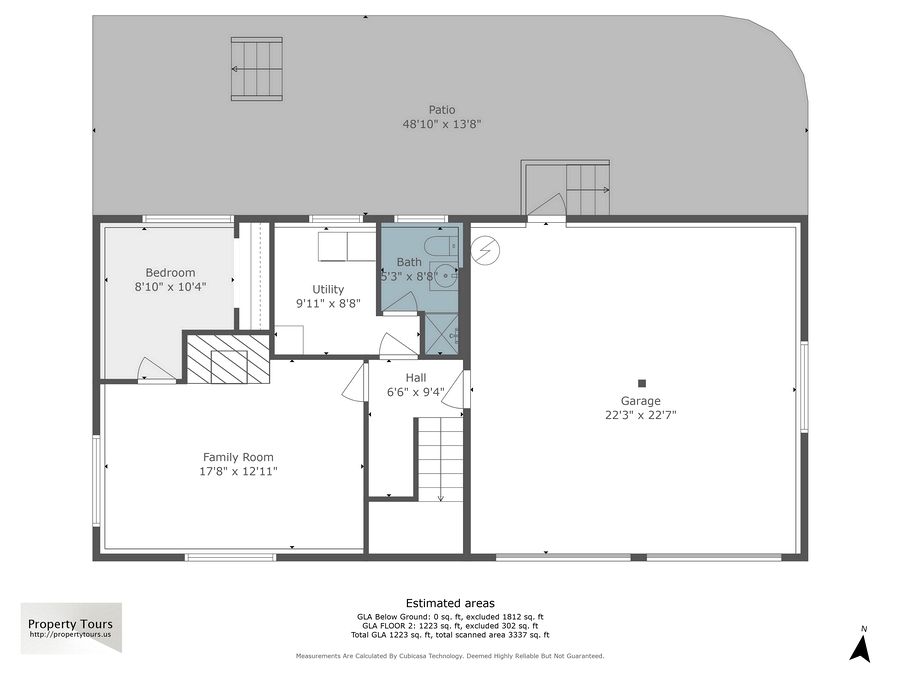
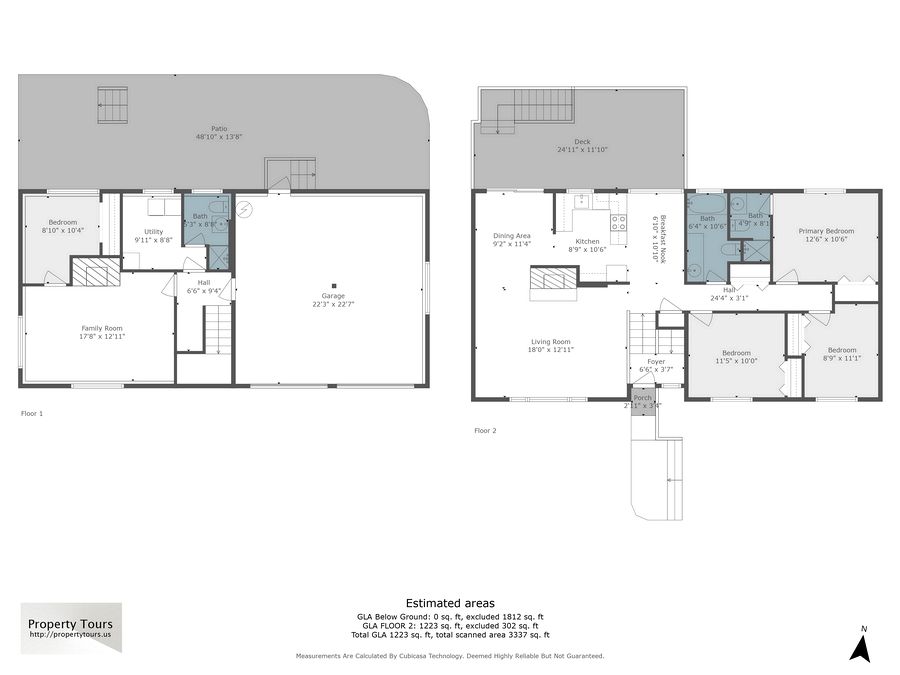
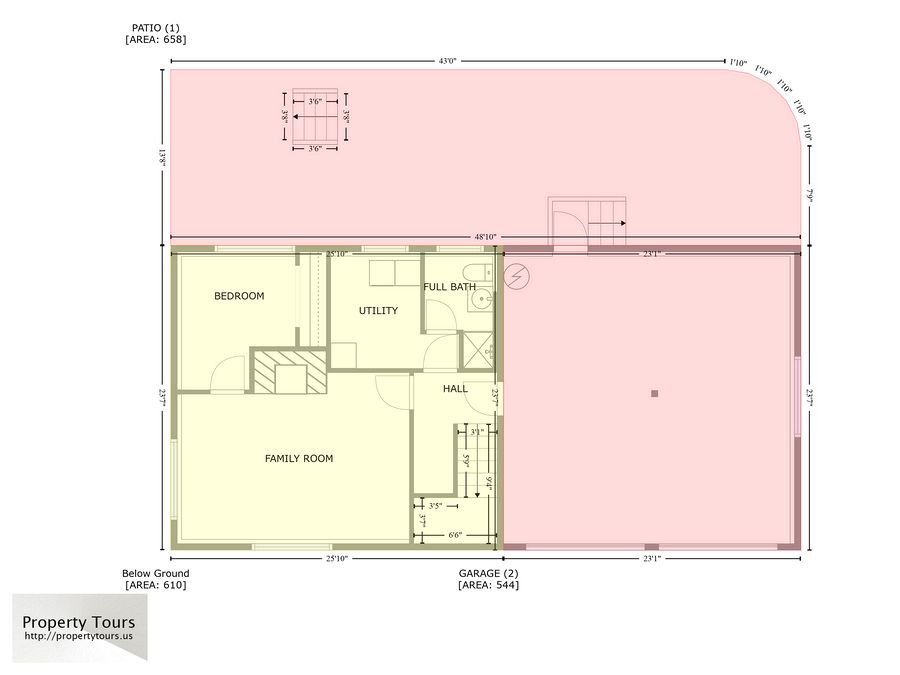
A 2D floorplan is always included with the 3D renderings. Patios, decks and entryway may not be possible. |
|
|
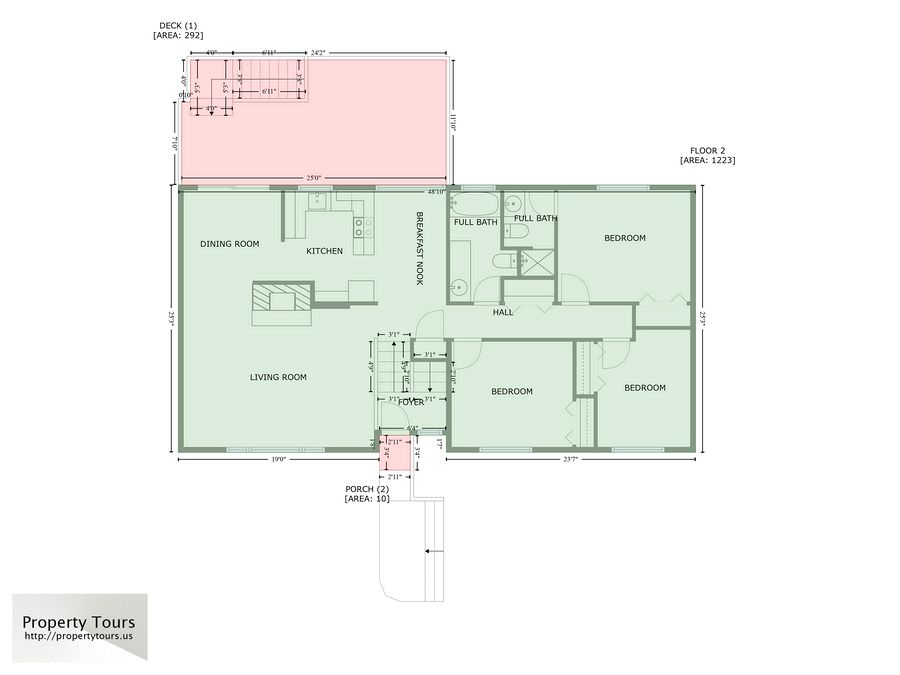
All 2D floorplans will also include a GLA (gross living area) rendering. The footage is printed on the 2D plans |
|
|
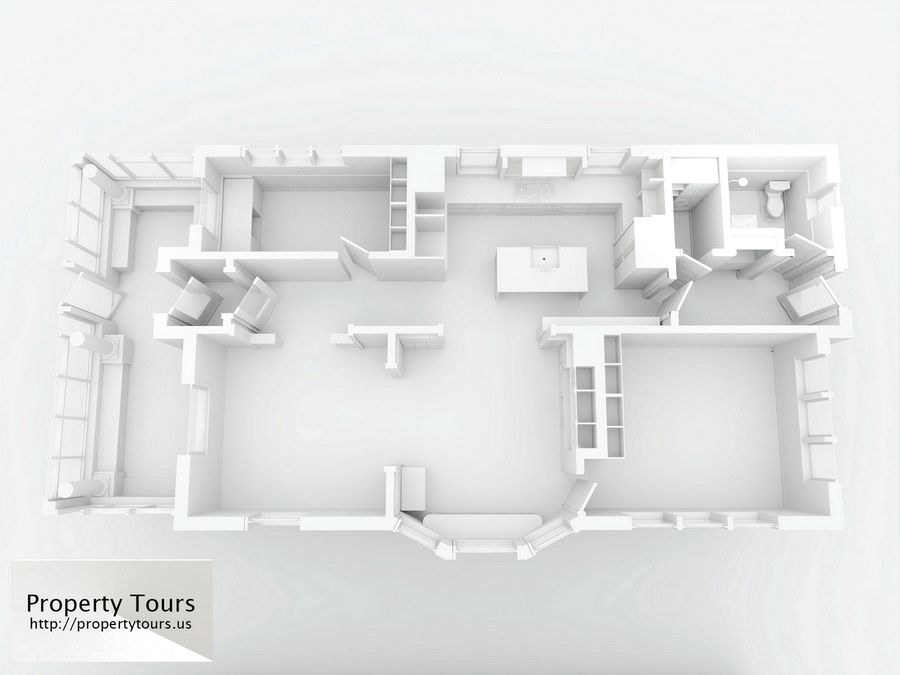
Plain black and white 3D rendering |
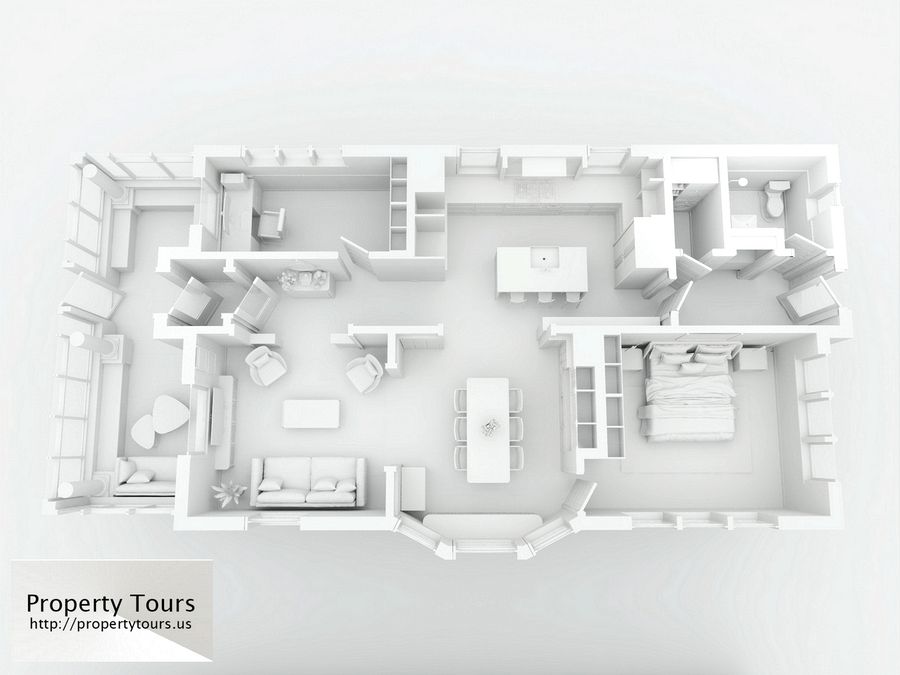
Black and white 3D floorplan with furnishings added. |
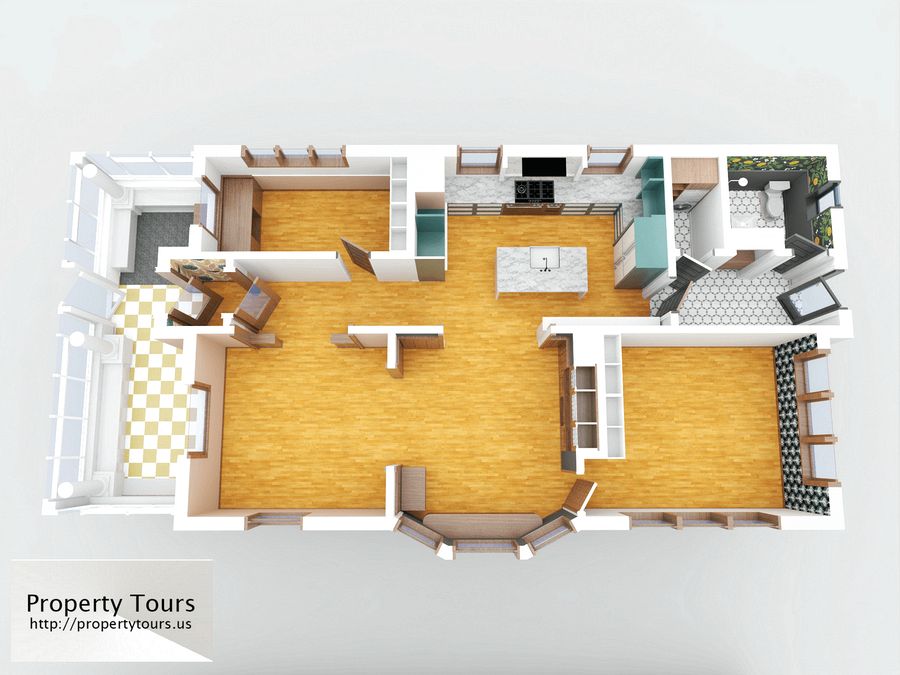
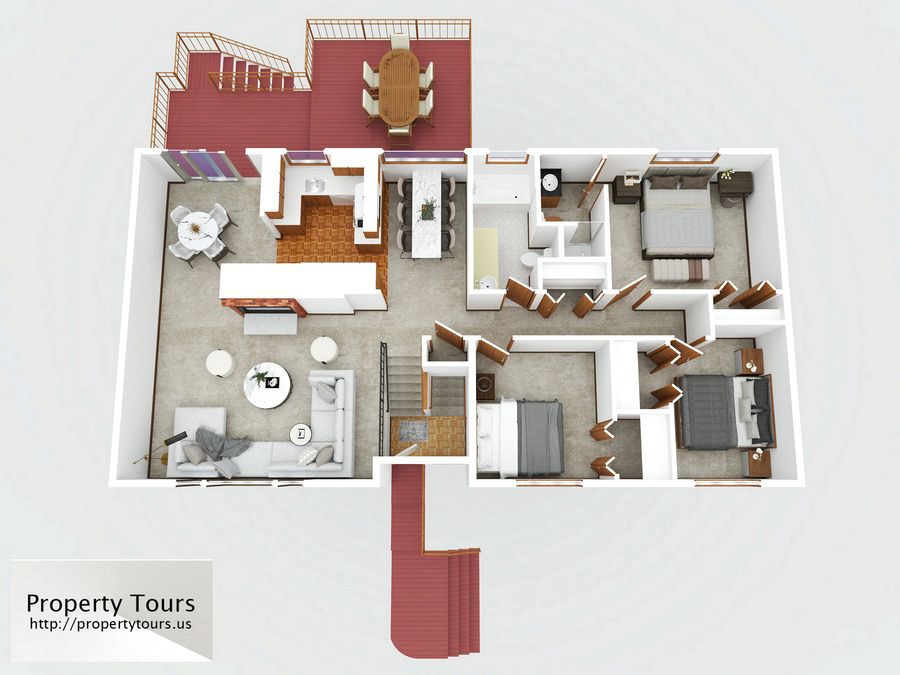
3D rendering with color, colors are picked from original scan. Flooring, carpet and tile representative of actual space. |
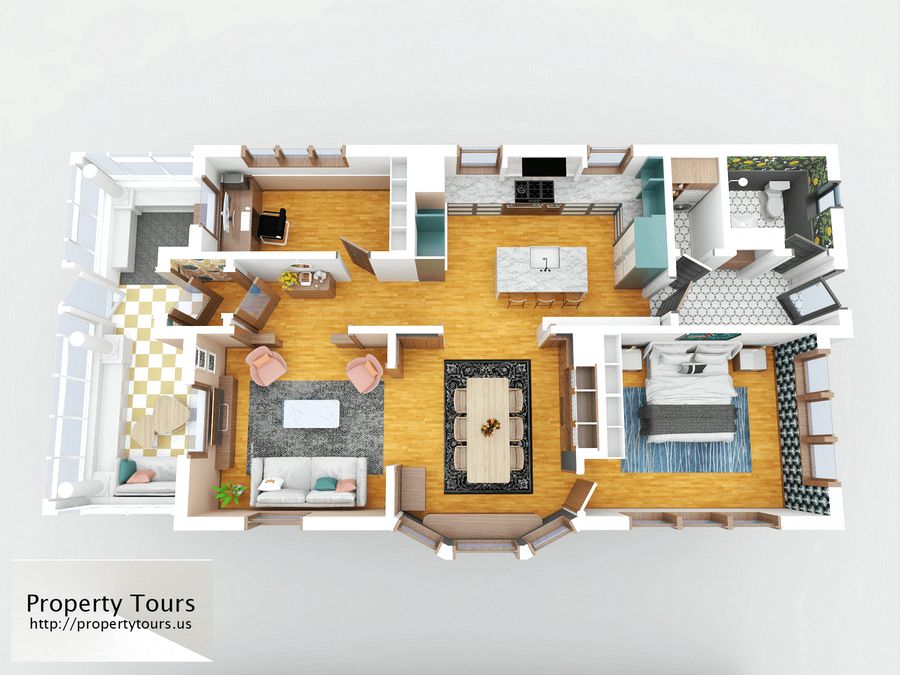
3D rendering with color, colors are picked from original scan. Flooring, carpet and tile representative of actual space. Fixed furniture and appliances are shown.Other furniture and throw rugs are just graphic representations. |
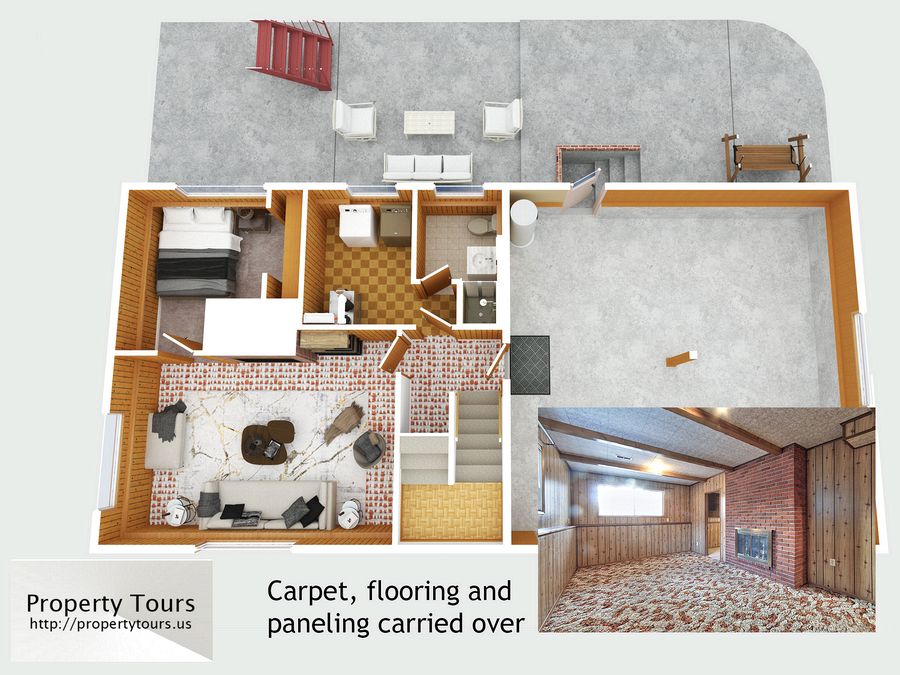
This rendering shows how the carpet, paneling and textures are picked up from the original scan. If your property is dated with sculptured 70’s shag carpet you may want to stay with the black and white renderings.This images also shown how the patio, entry and decks where included. This isn’t always possible or desired. |
This images also shown how the patio, entry and decks where included. This isn’t always possible or desired. |
Buyers: Results from the Zillow Consumer Housing Trends Report 2021
Importance of Virtual Home Tours Rises, Along with Desire for (Digital) Floor Plans
Buyer Desire for (Digital) Floor Plans Remains High
 Consistent with results in 2020, majorities of buyers in 2021 continue to agree at least somewhat with a series of statements on their desire for floor plans. While buyers continue to agree that they’re more likely to view a home if the listing includes a floor plan they like (81%), they are also similarly likely to agree that the only way to really understand the layout of a home is to see it in person (78%). The high agreement with both statements likely shows that most buyers want all the information they can get when searching for a home: Floor plans to help decide which homes to tour and an in-person visit for the homes with floor plans that fit their preferences.
| Share that agree somewhat/completely with each statement | 2020 | 2021 |
| I wasted time during my home search viewing properties that I would have skipped if I had understood their floor plan before my visit | 54% | 56% |
| I’m more likely to view a home if the listing includes a floor plan that I like | 79% | 81% |
| The only way to really understand the layout of a home is to see it in person | 76% | 78% |
| A dynamic floor plan that shows what part of the home each photo depicts would help me determine if the home is right for me | 71% | 74% |
Desire for 3D/Virtual Tours Remains High & Growing
Buyers in 2021 grew more likely to agree somewhat or completely with a series of statements on their preference for 3D and virtual tours — passing their already increased numbers in 2020. The largest increases were their agreement that 3D tours would help them get a better feel for the space than static photos (68% in 2021, up from 62% in 2020) and the share that agreed that they wish more listings had 3D tours available (61% in 2021, up from 55% in 2020).
| Share of buyers that agree somewhat/completely with each statement | 2019 | 2020 | 2021 |
| 3D tours would help me get a better feel for the space than static photos | 52% | 62% | 68% |
| I wish more listings had 3D tours available | 46% | 55% | 61% |
| I prefer 3D tours over in-person viewings | 26% | 35% | 38% |
| I prefer to schedule in-person tours online | – | 57% | 61% |
| It would be easier for me to unlock properties with my phone and tour them in-person on my own time | – | 59% | 63% |
Confidence Making an Offer Without an In-Person Viewing Creeps Up
The share of buyers that say they would be at least somewhat confident making an offer on a home after seeing a 360/virtual tour, but not an in-person viewing, increased slightly from 55% in 2020 to 58% in 2021. The share that says they would be very or extremely confident has stayed around a third — 32% in 2020 and a similar 34% in 2021.
| Buyer confidence making an offer on a home where they saw a 360/virtual tour, but did not view the home in person | 2020 | 2021 |
| Very/Extremely Confident | 32% | 34% |
| Somewhat Confident | 23% | 25% |
| Not at all/Not very Confident | 45% | 42% |